How to Use ASF's Data#
This provides an overview of some potential uses for the products available through ASF. The Overview section provides usage examples for each dataset, including dervived datasets, as well as the spatial coverage and mission dates for each. Dataset Details provides further detail on some of the products available through each dataset. There is also a Further Reading section.
Overview#
| Dataset | Dates | Usage Examples | Spatial Coverage |
|---|---|---|---|
| NISAR | 2025 - Present | ecosystems, ice masses, vegetation biomass, sea level, groundwater dynamics, geophysical processes, natural hazards, and more | Global |
| Sentinel-1 | 2014 - Present | Volcanoes, earthquakes, glaciers, land subsidence, sea ice, flooding, oceans, and more | Global |
| Sentinel-1 Bursts | 2014 - Present | Volcanoes, earthquakes, glaciers, land subsidence, sea ice, flooding, oceans, and more | Global |
| OPERA Sentinel-1 | 2014 - Present (varies by product) | Volcanoes, earthquakes, glaciers, land subsidence, sea ice, flooding, oceans, and more | Near-Global or North America (varies by product) |
| ALOS PALSAR | 2006 - 2011 | Glaciers, landslides, volcanoes, earthquakes, oil seeps, wetlands, sea ice, and more | The Americas, Antarctica, select wordwide sites |
| ALOS AVNIR-2 (Optical dataset) | 2006 - 2011 | Spatial coverage maps for land and coastal zones; monitoring regional environments | Global |
| SIR-C | 1994 | Carbon cycle, ecosystems, biogeochemistry, climate variability and change, land use, geology, hydrology, oceanography, snow and ice, vegetation, calibration, and technological experiments | Targeted worldwide sites |
| ARIA S1 GUNW | 2014 - Present | Deformation caused by earthquakes, volcanic eruptions, glacier movements, landslides, subsidence, and more | Select worldwide sites |
| SMAP | 2015 - Present | Soil moisture and freeze/thaw state (detailed data from 3 months in 2015); Benchmark data for flood, landslide, and drought monitoring; agricultural planning; and climate forecasting | Global |
| UAVSAR | 2008 - Present | Oil spills, earthquakes, volcanoes, oceans, land cover, earthquakes, wildfire scars, glaciers, subsidence, and more | Targeted worldwide sites |
| RADARSAT-1 | 1996 - 2008 | Arctic sea ice, volcanoes, ocean winds, ecology, soil moisture, wetlands, flooding, and more | Global |
| ERS-1 & ERS-2 | 1991 - 2011 | Polar regions and processes (sea ice, Arctic, Antarctic) | Primarily polar, within station masks of the ASF and McMurdo ground stations |
| JERS-1 | 1992 - 1998 | Important forests of the world: Southeast Asia, Africa, Central America, South America (Amazon Basin), and boreal North America | Global |
| AIRSAR | 1990 - 2004 | Oceans, coasts, forest ecology, geology, hydrology, earthquakes, archeaology, and more | Selected sites worldwide |
| Seasat | 1978 | Portions of northern oceans and land | Regions of Northern Hemisphere, including oceans and North America |
| Global Seasonal Sentinel-1 Interferometric Coherence and Backscatter Dataset | 2019 - 2020 | Deformation caused by earthquakes, volcanic eruptions, glacier movements, landslides, and subsidence, and more | All land masses and ice sheets from 82°N to 78°S |
| GISMO | 2006 - 2008 | Glaciers, ice sheets | Greenland Ice Sheet |
| Glacier Speed | 2007 - 2011 | Glaciers, glacial flow speeds, ocean-ice sheet interactions | Glaciers in Alaska |
| International Polar Year | 2007 - 2008 | Arctic and Antarctic relationships with geophysical elements, oceans and sea ice, Earth’s atmosphere, space, human relations, climate change | Arctic & Antarctic |
| RADARSAT-1 Antarctic Mapping Mission (RAMP) | 1997 and 2000 | Historic, high-resolution map of Antarctica: ice-sheet morphology, rock outcrops, research infrastructure, coastline, and more | Antarctica |
| Sea Ice MEaSUREs | 1995 - 2012 | Arctic Ocean sea ice motion with three-day radar snapshots as the ice goes through dramatic changes over 11 years | Arctic Ocean |
| Wetlands MEaSUREs | 1993 - 2009 | Wetlands ecology, including their role in climate, biogeochemistry, hydrology, and biodiversity | Amazon, Alaska, the Americas, global (coarse resolution) |
Dataset Details#
NISAR#
NISAR offers global coverage with L-band and S-band SAR. The NISAR mission generates a number of analysis-ready SAR datasets. These Level 2 (Geocoded) and Level 3 (Geophysical) products are archived and freely available to the public. This allows users without the software or expertise necessary to process SAR data easy access to products that can be used in analysis workflows.
NISAR addresses the needs of Solid Earth, Ecosystems, Cryospheric, and Soil Moisture science disciplines. For more information on the NISAR products, please see the user guide.
Sentinel-1#
Sentinel-1 offers global coverage with C-Band SAR. Sentinel-1A was launched in 2014, and Sentinel-1B was launched in 2016. Each satellite has a 12 day repeat cycle, and some areas have coverage every 6 days. New acquisition data is available to download within 3 days, though it is most often available within 24 hours. The data is free and easy to download in several formats.
Note: As of December 23, 2021, the Sentinel-1B mission has ended due to an anomaly. This affects the coverage cycle in some areas. More information can be found here.
RAW#
RAW products require calibration & processing steps before the data is analysis-ready. These products are best suited for use by SAR specialists.
GRD#
Ground Range Detected (GRD) products are best for amplitude applications, such as generating RTC images. These are Level 1 products. These products are georeferenced, and multi-looked into a single image. Only amplitude information is included in the GRD.
- No effort required to view data in a GIS software
- Easy to project to desired coordinate system
- Pixels are in ground-detected geometry
- One consolidated image for each polarization
- Square pixels
- Smaller file size
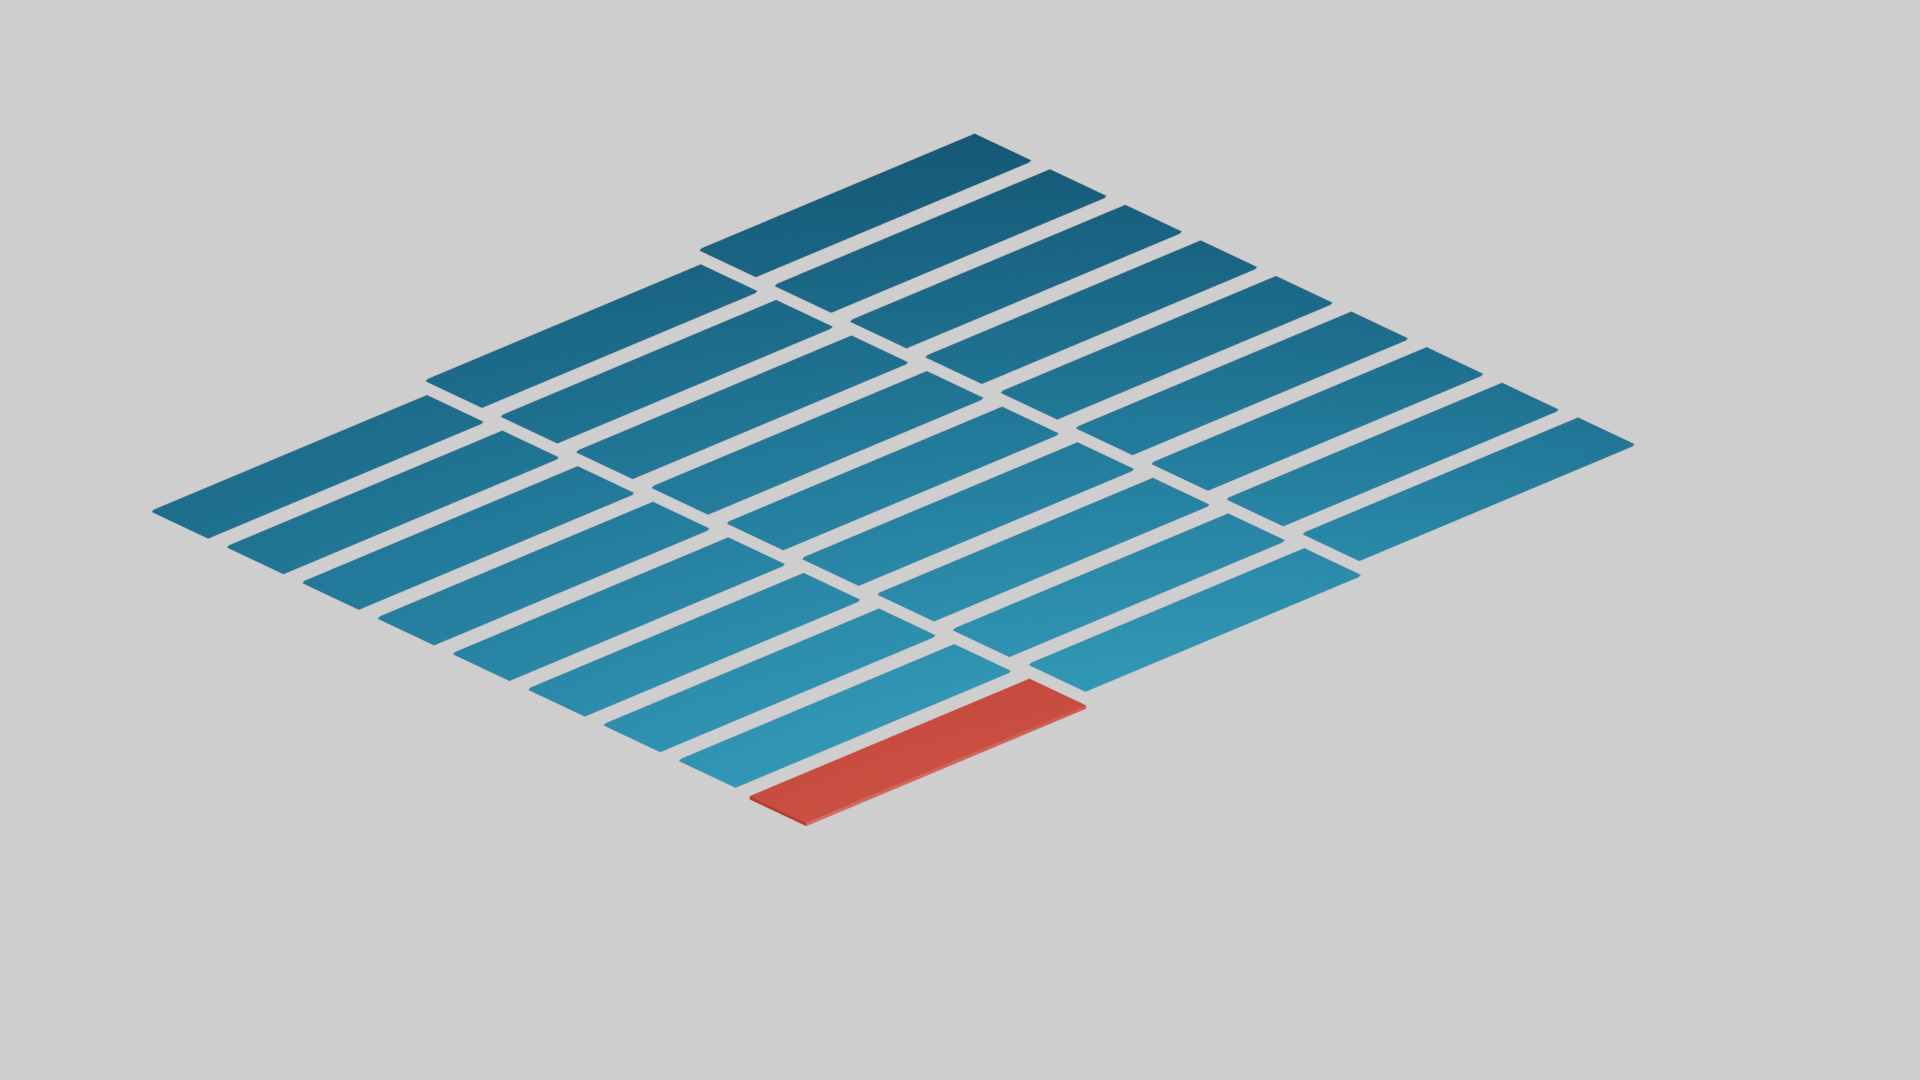
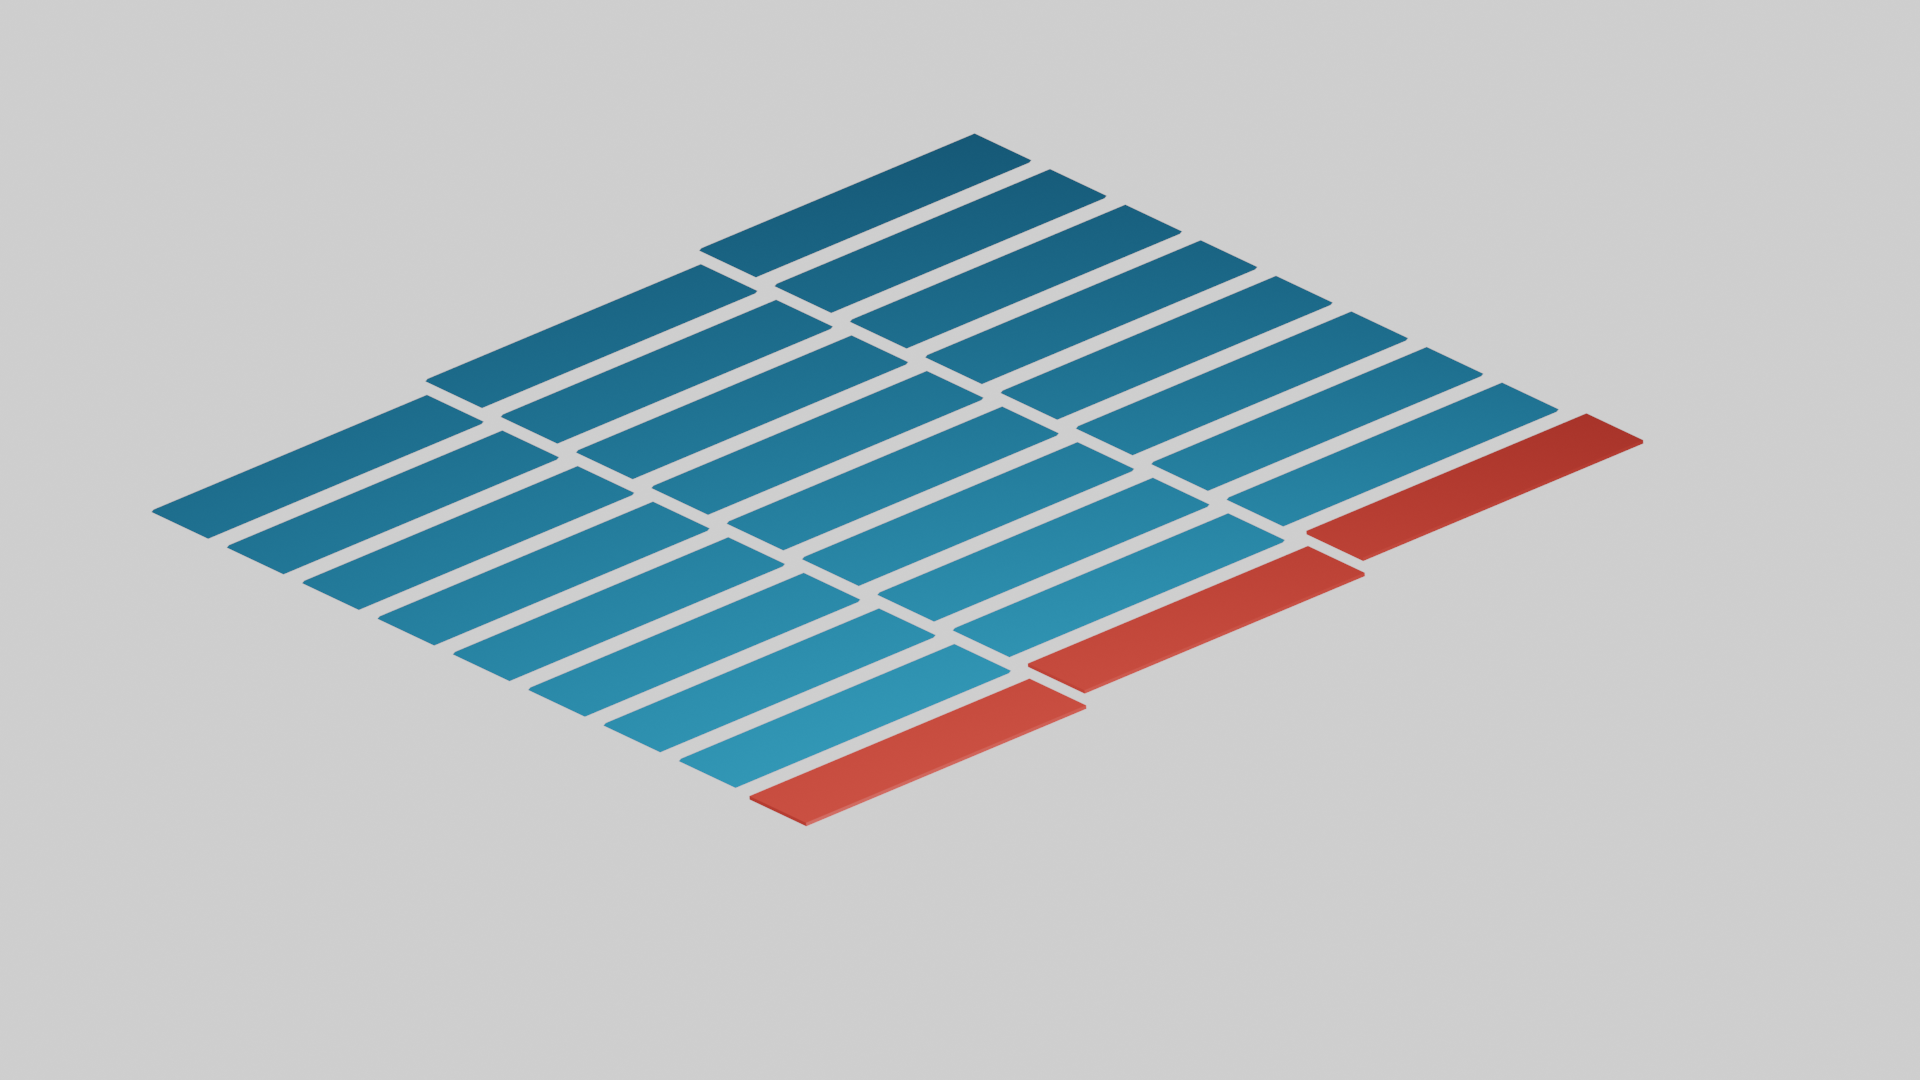
SLC#
Single Look Complex (SLC) products are necessary for interferometry. These are Level 1 products. These products are comprised of 3 GeoTIFFs, one for each of the sub-swaths, and each radar burst is included in the data. The SLC includes phase data.
- Remains in slant-range geometry
- Phase data is retained
- Suitable for detecting changes in surface elevation
- Required for generating interferograms
- Several images for each SLC
- Retains each subswath (including overlap) and series of bursts, with a black line grid
OCN#
OCN products are higher level products, generated from the Level 1 products. These products are focused on ocean applications, including waves & wind direction.
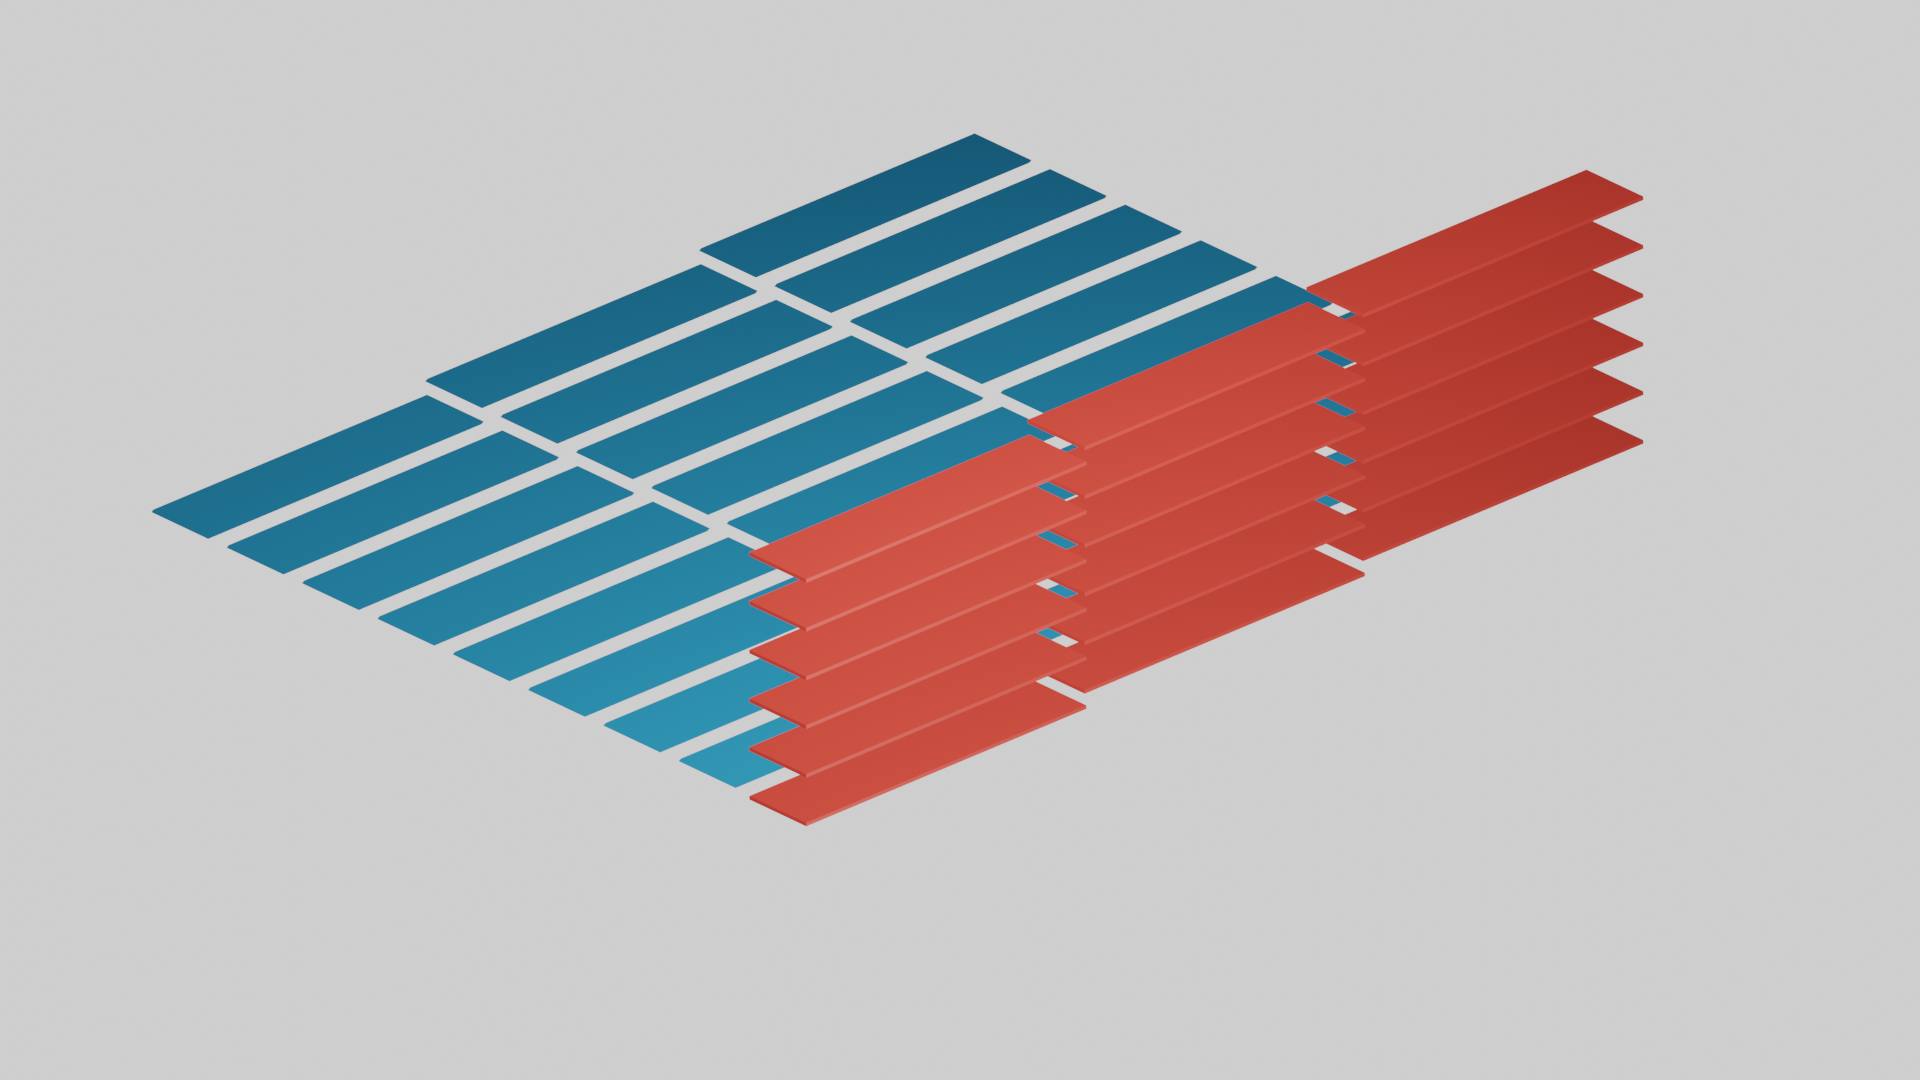
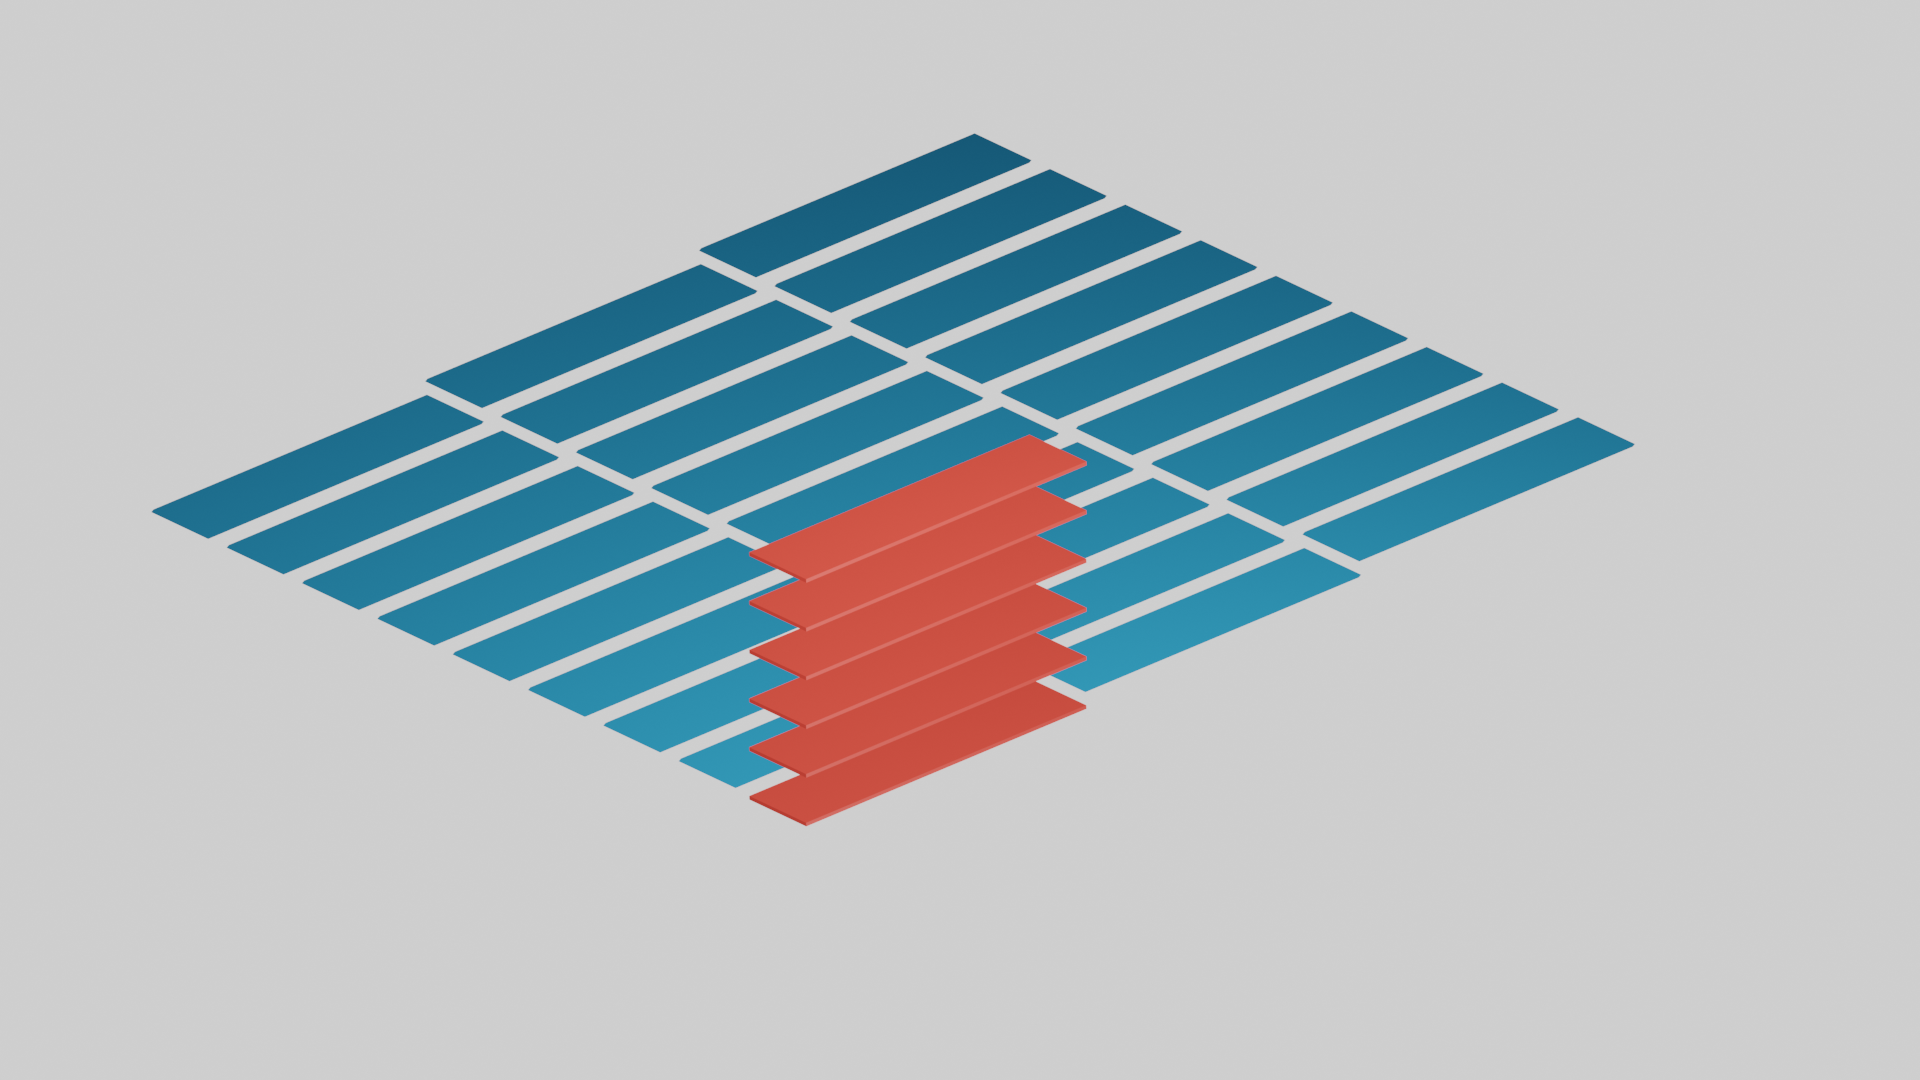
Sentinel-1 Bursts#
A Sentinel-1 SLC contains multiple measurement TIFFs that contain the radar response data. Each measurement TIFF can be further broken down into a single radar pulse response message which is referred to as a burst.
There are multiple parameters that allow searching for bursts across sub-swaths and burst cycles. Depictions of a single burst, and the three available burst-related IDs are below.
Single burst:
Absolute Burst ID:
Relative Burst ID:
Full Burst ID:
Each burst file also has a corresponding XML Metadata file available. The Burst XML Metadata is a virtually generated file, and therefore does not have its own unique filename. The XML Metadata can only be found via the burst scene name, and is not searchable in a list search.
OPERA Sentinel-1#
Observational Products for End-Users from Remote Sensing Analysis (OPERA) is a project at the Jet Propulsion Laboratory (JPL), created to address high-priority requests from the NASA Satellite Needs Working Group and its partners for products generated from SAR and optical sensors.
The following OPERA products can be found through Vertex, asf_search, or the SearchAPI:
- Near-global land surface Radiometric Terrain Corrected (RTC) backscatter product
- Near-global land surface Radiometric Terrain Corrected (RTC) backscatter static layers product
- North America Coregistered Single-Look Complex (CSLC) product
- North America Coregistered Single-Look Complex (CSLC) static layers product
“Near-global” corresponds to all landmasses excluding Antarctica. “North America” corresponds to the United States and U.S. Territories, Canada within 200 km of the U.S. border, and all mainland countries from the southern U.S. border up to and including Panama.
The near-global RTC products are available from 2023 to present. The North America CSLC products will be available from 2014 to present.
RTC#
The Radiometric Terrain Corrected (RTC) Backscatter product consists of Sentinel-1 radar backscatter data normalized with respect to the topography. It is a Level-2 product that is projected onto a pre-defined UTM/Polar stereographic map projection system. The Copernicus Global 30 m (GLO-30) Digital Elevation Model (DEM) is the reference DEM used to correct for the impacts of topography and to geocode the product. The product is provided in a GeoTIFF file format. The RTC metadata is in HDF5 format.
RTC Static#
The RTC-STATIC product is a Level 2 product that contains static radar geometry layers associated with the RTC product.
CSLC#
The Coregistered Single-Look Complex (CSLC) product consists of SLC images that are precisely aligned or “coregistered” to a pre-defined UTM/Polar stereographic map projection system. The CSLC images contain both the amplitude and phase information of the complex radar return. The Level-2 CSLC product is derived from Sentinel-1 data and is provided in HDF5 format.
CSLC Static#
The CSLC-ST product serves as an ancillary product to the CSLC products and is distributed separately from the CSLC products. It is only produced once (or a limited amount of times) for CSLC products characterized by the same burst identification string i.e., for all the Sentinel-1-A/B bursts covering the same geographical area on the ground.
ALOS PALSAR#
ALOS PALSAR offers historical data, and has some analysis-ready RTC (Radiometric Terrain Corrected) products, processed by ASF.
RTC#
Note that a resampled DEM (SRTM or NED) was used for RTC processing. DEM information can be found here. These RTCs can be used to replace optical imagery in areas with frequent cloud cover. They may also be used to improve land cover classification. More advanced processing techniques include data fusion, either on a pixel level or on a feature level, using an object-oriented approach.
- Projected to UTM coordinates
- Hi-Res Terrain Corrected products are 12.5 meter resolution
- Low-Res Terrain Corrected products are 30 meter resolution
The ALOS PALSAR Product Guide can be found here.
Level 2.2#
These products are projected in a custom Japan Aerospace Exploration Agency (JAXA) datum. These products require reprojection to the appropriate UTM zone before they can be analyzed in a GIS software.
Level 1.5#
These products are in CEOS data format, and do not contain a spatial reference. These must be geocoded before any processing or analysis. Once geocoded, these may be exported as GeoTIFF files. This data recipe uses ASF’s MapReady software to view and geocode CEOS format files.
ALOS AVNIR-2#
ALOS AVNIR-2 is an optical dataset that offers historical data. These products are ortho rectified images (ORI). Orthorectification is the process of removing image distortions caused by the sensor and terrain to create a planimetric image at every location with consistent scale across all parts of the image. This allows the overlay of various geospatial information with the ORI on any map. The products contain 4 bands, and each image has 30% cloud cover or less.
SIR-C#
SIR-C was flown on two missions, six months apart. The first mission dates were April 9-20, 1994 and the second mission dates were September 30-October 11, 1994. The second flight followed nearly the same orbit as the first flight. Therefore, there are repeat-pass products available, enabling interferometric SAR processing over these areas.
ARIA S1 GUNW#
These products are already processed interferograms. You may download either the full netCDF product, or select GeoTIFF layers. These are analysis-ready InSAR products. These products do have a limited spatial coverage.
SMAP (Soil Moisture Active Passive)#
SMAP was launched with both an active and a passive sensor to collect high-resolution soil moisture data globally. Unfortunately, the active SAR sensor malfunctioned a few months into the mission. The passive sensor is still ongoing. With only the passive sensor functional, the soil moisture data is in a coarse resolution. The coarse resolution products can still be used for regional analysis or larger-scale projects.
- 2015 - Present
- Active sensor data available for the first 3 months
- L-band
- Measures soil moisture and freeze-thaw state in top 5 cm of soil globally every three days (multi-kilometer resolution)
- High resolution capabilities lost with loss of active sensor
- Recent efforts to integrate Sentinel-1 data have generated higher-resolution products
- Variety of soil moisture products available here
UAVSAR#
UAVSAR offers airborne acquisitions of targeted locations. Because the acquisitions are targeted, there are generally not repeat passes over one area. However, if UAVSAR covers your area of interest, this dataset includes a variety of available products.
- 2008 - present
- Quad-pol L-band
- Airborne, targeted locations, irregular timing
- Flights can be requested for your area of interest
- Pre-processed backscatter and interferometric products
- PolSAR and Repeat-Pass Interferometry
KMZ#
These products are georeferenced products. These can be used in Google Earth, or other applications that support kmz format files. These products have a 6 meter pixel spacing.
- Beam Mode POL: These contain a polarimetry single-pass product, using a quad-pol backscatter decomposition.
- Red: HH; Green: HV; Blue: VV
- Beam Mode RPI: These products are generated from two passes. In addition to the polarimetry product, these also include amplitude, correlation, interferometry, and digital elevation map products.
- The amplitude product contains backscatter for each polarization
- The correlation product is phase coherence between passes
- The interferometry product shows landscape changes
- The digital elevation map product is for reference
RADARSAT-1#
These products are in CEOS data format, and do not contain a spatial reference. These must be geocoded before any processing or analysis, and once geocoded, may be exported as GeoTIFF files. RADARSAT-1 is restricted data, and requires a research agreement to download. This data recipe uses ASF’s MapReady software to view and geocode CEOS format files.
- Level 0 products are unprocessed / raw data
- Level 1 products are amplitude processed images
ERS#
These products are in CEOS data format, and do not contain a spatial reference. These must be geocoded before any processing or analysis, and once geocoded, may be exported as GeoTIFF files. This data recipe uses ASF’s MapReady software to view and geocode CEOS format files.
- ASF holds a subset of the ERS data, focused on Alaska, Western Canada, Chukotka and Antarctica
- Level 0 products are unprocessed / raw data
- Level 1 products are amplitude processed images
JERS#
These products are in CEOS data format, and do not contain a spatial reference. These must be geocoded before any processing or analysis, and once geocoded, may be exported as GeoTIFF files. JERS-1 is restricted data, and requires a research agreement to download. This data recipe uses ASF’s MapReady software to view and geocode CEOS format files.
- Level 0 products are unprocessed / raw data
- Level 1 products are amplitude processed images
AIRSAR#
AIRSAR offers airborne acquisitions of targeted locations. These acquisitions cover primarily the United States, and some tropical locations. The campaign name listed for each product is its acquisition location. Because the acquisitions are targeted, there are generally not repeat passes over one area. However, if AIRSAR covers your area of interest, there are a variety of sensors and frequencies available. There are JPGs available, though they are not georeferenced.
Beam Mode: POLSAR or 3FP#
In POLSAR mode, fully polarimetric data are acquired at all three frequencies in P-, L-, C-band for 40 Mhz or 20 Mhz. The L-band also provides 80 MHz bandwidth data. POLSAR data are sensitive to the geometry (including vegetation) and dielectrical properties (water content) of the terrain.
Beam Mode: TOPSAR or XTI#
In TOPSAR mode, AIRSAR collects interferometric data using C- and L-band to produce digital elevation models (DEMs). The radars which are not being used for interferometry collect quad-pol data co-registered with the C-band DEM. Interferometric data can be collected in "ping-pong" mode, where each antenna is used alternately for transmit and the effective baseline is doubled, and in "common-transmitter" mode where only one antenna is used for transmit.
Beam Mode: ATI#
In the along-track interferometry (ATI) mode, AIRSAR collects data C- and L-band. Data collected can be used to measure ocean current velocities.
Seasat#
Seasat was the first spaceborne SAR mission, launched in 1978. This data has been processed by ASF into digital imagery. These products may have substantial geolocation errors.
HDF5#
The backscatter values are contained in the HH layer. In order to provide basic geolocation information, two additional layers, latitude and longitude, are added. They contain geographic coordinates for every pixel in the image. The time variable completes the compliance to the Climate and Forecast (CF) metadata conventions.
GeoTIFF#
These products are geocoded to the UTM map projection, using the zone that best represents the data's geolocation. The original 12.5 meter pixel size and the floating-point values of the ground range HDF5 products are kept in the GeoTIFF format. This product type contains only a single layer, and is therefore considerably smaller than the HDF5 product.
Global Seasonal Sentinel-1 Interferometric Coherence & Backscatter Dataset#
This dataset is the first-of-its-kind spatial representation of multi-seasonal, global SAR repeat-pass interferometric coherence and backscatter signatures. Global coverage comprises all land masses and ice sheets from 82 degrees northern to 78 degrees southern latitude. The dataset is derived from high-resolution multi-temporal repeat-pass interferometric processing of about 205,000 Sentinel-1 Single-Look-Complex (SLC) data acquired in Interferometric Wide-Swath (IW) mode from Dec 1, 2019 to Nov 30, 2020.
The dataset covers several seasonal metrics, listed below. The seasons consist of December, January, February (DJF); March, April, May (MAM); June, July, August (JJA); and September, October, November (SON).
- Median 6-, 12-, 18-, 24-, 36-, and 48-day repeat coherence estimates for C-band VV and HH polarized data
- Mean backscatter (γº) for VV, VH, HH, and HV polarizations
- Seasonal coherence decay model parameters rho, tau, and rmse
- Local incidence and layover/shadow regions for all relative Sentinel-1A and Sentinel-1B orbits. Note that in the dataset filenames seasons were referred to as northern hemisphere winter (DJF), spring (MAM), summer (JJA), and fall (SON).
Data Products#
- Coherence Tiles separated by latitude
- Virtual Raster tables
- Global mosaics separated into seasons
GISMO#
The Global Ice-Sheet Mapping Observatory (GISMO) project had a specific focus in measuring the surface topography of ice sheets, ice-sheet thickness, and in uncovering physical properties of the glacier bed using SAR.
The GIMSO project had documented flight lines over the Greenland Ice Sheet in 2006, 2007, and 2008. It utilized VHF and P-band interferometric radars and tested different methods of clutter rejection in order to find the method most suitable for the project’s focus.
GISMO achieved mapping the physical properties of a glacier bed through up to 5 km of ice. It also created an effective clutter rejection technique for measuring the ice sheet’s surface and base. GISMO has applications in predicting the effects of climate change on ice sheets and in exploring planets with icy areas.
Data Products#
- 150 MHz Data Products: May 23, 2006
- 450 MHz Data Products: Sept 10, 2007
- 150 MHz Data Products: Sept 12, 2007
- Low Aircraft Elevation Data Products: 2008
- High Aircraft Elevation Data Products: 2008
For these products, each flight line was segmented into approximately 25 km long sections with 20% overlap on each end.
Glacier Speed#
Glacier Speed is the first near-comprehensive dataset of wintertime glacier-flow speeds throughout Alaska, and reveals complex patterns of glacier flow throughout the state. The findings significantly advance understanding of the mechanisms responsible for the rapid glacier mass loss occurring in Alaska.
The patterns include glacier surging and spatial variations in flow related to climate. Notably, the data show that out of tens of thousands of glaciers in Alaska, only 12 are responsible for the majority of downstream ice flux. These glaciers are flowing exceptionally fast because they receive very high rates of snowfall and are not necessarily flowing fast because of tidewater retreat. (The flow speed is not the same as the melt rate; melting is strong enough at low elevations that it is outpacing the high snowfall rates.)
The data have also revealed that iceberg calving in Alaska is an important component of the statewide glacier mass budget: The volume of calved ice is 17.1 km3 – or roughly equivalent to a third of the annual net glacier mass change in Alaska.
Data Products#
- KMZ format statewide glacier-flow-speed map
- ZIP file that includes readme file and a speed.tif, ids.tif, and .par file for each of the nine regions
The nine regions are: Central Alaska Range, Chugach Mountains, Coastal Range, Delta Range, Fairweather Range - Glacier Bay, Hayes Range, Kenai Mountains, Tordrillo Mountains, and Wrangell Mountains - St. Elias Mountains
The flow-speed data are gridded on 90-meter-resolution UTM grids as GeoTIFFs. The grids are divided into different regions and include a speed file that contains the mosaicked flow speed in meters/day (32-bit float) and a ids file that contains integer IDs that correspond to the image pair used for determining flow speed at each pixel (16-bit integer).
The dates of the image pairs used can be found by looking up image IDs in the corresponding .par file. In some cases, the .par file will contain IDs that are not in the ids grid. In these cases, these image pairs were simply not needed in the final mosaic. The .par file also includes georeference information in a text format.
International Polar Year#
ASF hosts an archive of the International Polar Year (IPY) project titled the Global Inter-agency IPY Polar Snapshot Year (GIIPSY). GIIPSY’s objective was to obtain high-definition satellite snapshots of the polar regions during 2007-2008. The primary purpose is to use these snapshots as benchmarks for gauging past and future environmental changes in the polar ice, ocean, and land.
Data Products#
- Greenland L0 Kongsberg
- Greenland Level 0 (September 2000-January 2001)
- Greenland Level 1 (September 2000-January 2001)
- Antarctica Level 1 (September 2000-January 2001)
- Toolik Station Level 1 (October 2004-December 2006)
- Kamchatka Level 1 (December 1999-January 2000)
- Sea Ice Snapshots (Min & Max Snapshots, September-March of 2003-2004, 2004-2005, 2005-2006, 2006-2007)
RAMP#
The RADARSAT-1 Antarctic Mapping Project (RAMP) was composed of two main missions, the first Antarctic Mapping Mission (AMM-1) and the Modified Antarctic Mapping Mission (MAMM). Both missions utilized RADARSAT-1.
AMM-1 started on September 9, 1997 and was completed on October 20, 1997. Its goals were to acquire a complete map of Antarctica and better understand the relationships between the southernmost continent’s environmental elements. Using the right- and left-looking abilities of RADARSAT-1, a mosaic map of Antarctica at 25 meter resolution was created. The map displayed Antarctica’s geological features through variations in radar brightness and texture, including ice streams. Ice velocity vectors were compiled using AMM-1 data to measure ice sheet movement over ice streams.
MAMM began three years after AMM-1 ended, starting on September 3, 2000 and ending on November 17, 2000. It planned to remap Antarctica and measure ice velocity data using interferometric analysis and data from AMM-1. In the three years’ difference between the two main Antarctic Mapping Missions, ice sheet advance and retreat could be observed and better evaluated as episodic change or regional climate change.
Data Products#
- 25 meter Final Tiles
- 25 meter Tile Overviews
- 16 bit 25 meter Tile Overviews of the backscatter coefficient in dB
- 200 meter Final Coherence (ascending and descending)
- 200 meter Coherence Overviews (ascending and descending)
- A variety of mosaic products
- AMM-1 & MAMM Coastline
- AMM-1 & MAMM Control points
- DEMs
- East Antarctic
- Velocity Product
- Balance Velocity Map
Sea Ice MEaSUREs#
The data and imagery available from ASF cover a period from 1995 to 2011. They include more than 11 years of near-uninterrupted, three-day radar snapshots of Arctic and Southern Ocean’s sea ice as it goes through dramatic change.
Uses include:
- New approaches for modeling the mechanical behavior of sea ice and the validation of these models
- Characterization of sub-daily ice motion
- Description of the seasonal and regional variability of sea-ice deformation
- Validation of ICESat freeboard algorithms
- Estimates of sea-ice exchange between the Arctic and Southern Oceans and peripheral seas
Data Products#
- A dataset of small-scale kinematics and deformation processed by tracking sea ice on a high-resolution grid.
- The original synthetic aperture radar (SAR) images.
Wetlands MEaSUREs#
These products from the NASA Inundated Wetlands MEaSUREs project facilitate investigations on the role of wetlands in climate, biogeochemistry, hydrology, and biodiversity.
The inundated wetlands Earth System Data Records consists of two primary components:
- Fine-resolution maps of wetland extent, vegetation type, and seasonal inundation dynamics, derived from SAR for regional and continental-scale areas covering crucial wetlands systems. These are created using data from a variety of spaceborne SARs. The wetlands datasets were generated using algorithms appropriate to the nature of the wetlands systems under study, including time series and statistically-based tree classifiers.
- Global, coarse-resolution time series mappings of inundated area fraction at 25 km resolution derived from multiple satellite remote sensing observations including passive and active microwave sensors and optical data sets optimized for inundation detection. The algorithm employed in the generation of this dataset employs a clustering model and a mixture model in the classification of fractional inundated areas. These datasets are provided on a bi-monthly basis for 1992-1999 and daily for 2000 onward. Annual summary products, including maximum inundated extent and annual inundation duration, are provided. A daily near real time (NRT) dataset with 2-3 day latency is also provided.
Data Products#
- Surface WAter Microwave Product Series (SWAMPS)
- North America JERS-1 Mosaics
- Alaska Wetlands Map derived from ALOS PALSAR fine beam data
- Alaska Wetlands Map derived from JERS-1 SAR
- Amazon Low and High Flood Backscatter Mosaics from JERS-1 SAR
- Time-series Amazon Wetlands Extent Maps derived from PALSAR ScanSAR data