Displacement Products FAQs#
What datasets are visualized in the Displacement Portal?#
The Displacement Portal displays the Basic Velocity on a map and time series of displacements at point locations on a plot. This information is derived from the short wavelength displacement layers found within each OPERA DISP dataset. The short wavelength displacement layer is made for visualization purposes and to highlight relative displacement between nearby locations.
How is the Basic Velocity calculated?#
For each of ASCENDING and DESCENDING:
-
For each frame, create an average velocity GeoTIFF by:
- Create a short wavelength displacement time series using the minimum set of granules spanning the full temporal extent of the available data
- Take a linear regression of that time series to determine average velocity (i.e., slope of linear regression fit)
- Set values outside [-0.03 m/yr, +0.03 m/yr] to -0.03 and +0.03
-
Overlay the individual frame GeoTIFFs into a mosaic
- In areas where multiple frames overlap, prefer showing near-range pixels over far-range pixels (e.g. easternmost frame on top for ascending, westernmost on top for descending)
- If the preferred frame has no data for a particular pixel, let the data value of the less-preferred frame show through
What is “short-wavelength displacement”?#
The short wavelength displacement represents ground movement measured in the satellite line-of-sight (LOS) direction with large wavelength (spatial scale >30 km) signals filtered, so that the displayed data highlights local displacement signals and relative displacement between nearby locations. As a result, large-scale signals such as atmospheric effects, large-scale subsidence, and tectonic plate motion are filtered. In some cases the short wavelength displacement signal can result in unrealistic displacements (i.e., uplift within an area of subsidence), particularly if the long wavelength signal is large or complex (see the Interpret Measurements section).
How do I interpret measurements displayed in the Displacement Portal?#
The filtering approach used to generate the short wavelength layers is intended to highlight local displacement by removing large spatial signals that exceed the filter kernel size of 30 km. The short wavelength layer is created to reduce the impact of atmospheric noise in InSAR data. However other large spatial scale (i.e., > 30 km) signals, such as subsidence in Central Valley, California, are also impacted. The short wavelength layer values for locations such as those will look different than the unfiltered values in the OPERA DISP product's Displacement layer. Note that due to the short wavelength filtering process, there is no local spatial reference point.
Below we demonstrate synthetic examples of short wavelength filtered and unfiltered displacement signals. The examples show that residual patterns that do not reflect true displacement can emerge after filtering (see Figure 1 below).
More details can be found in this notebook.
Figure 1
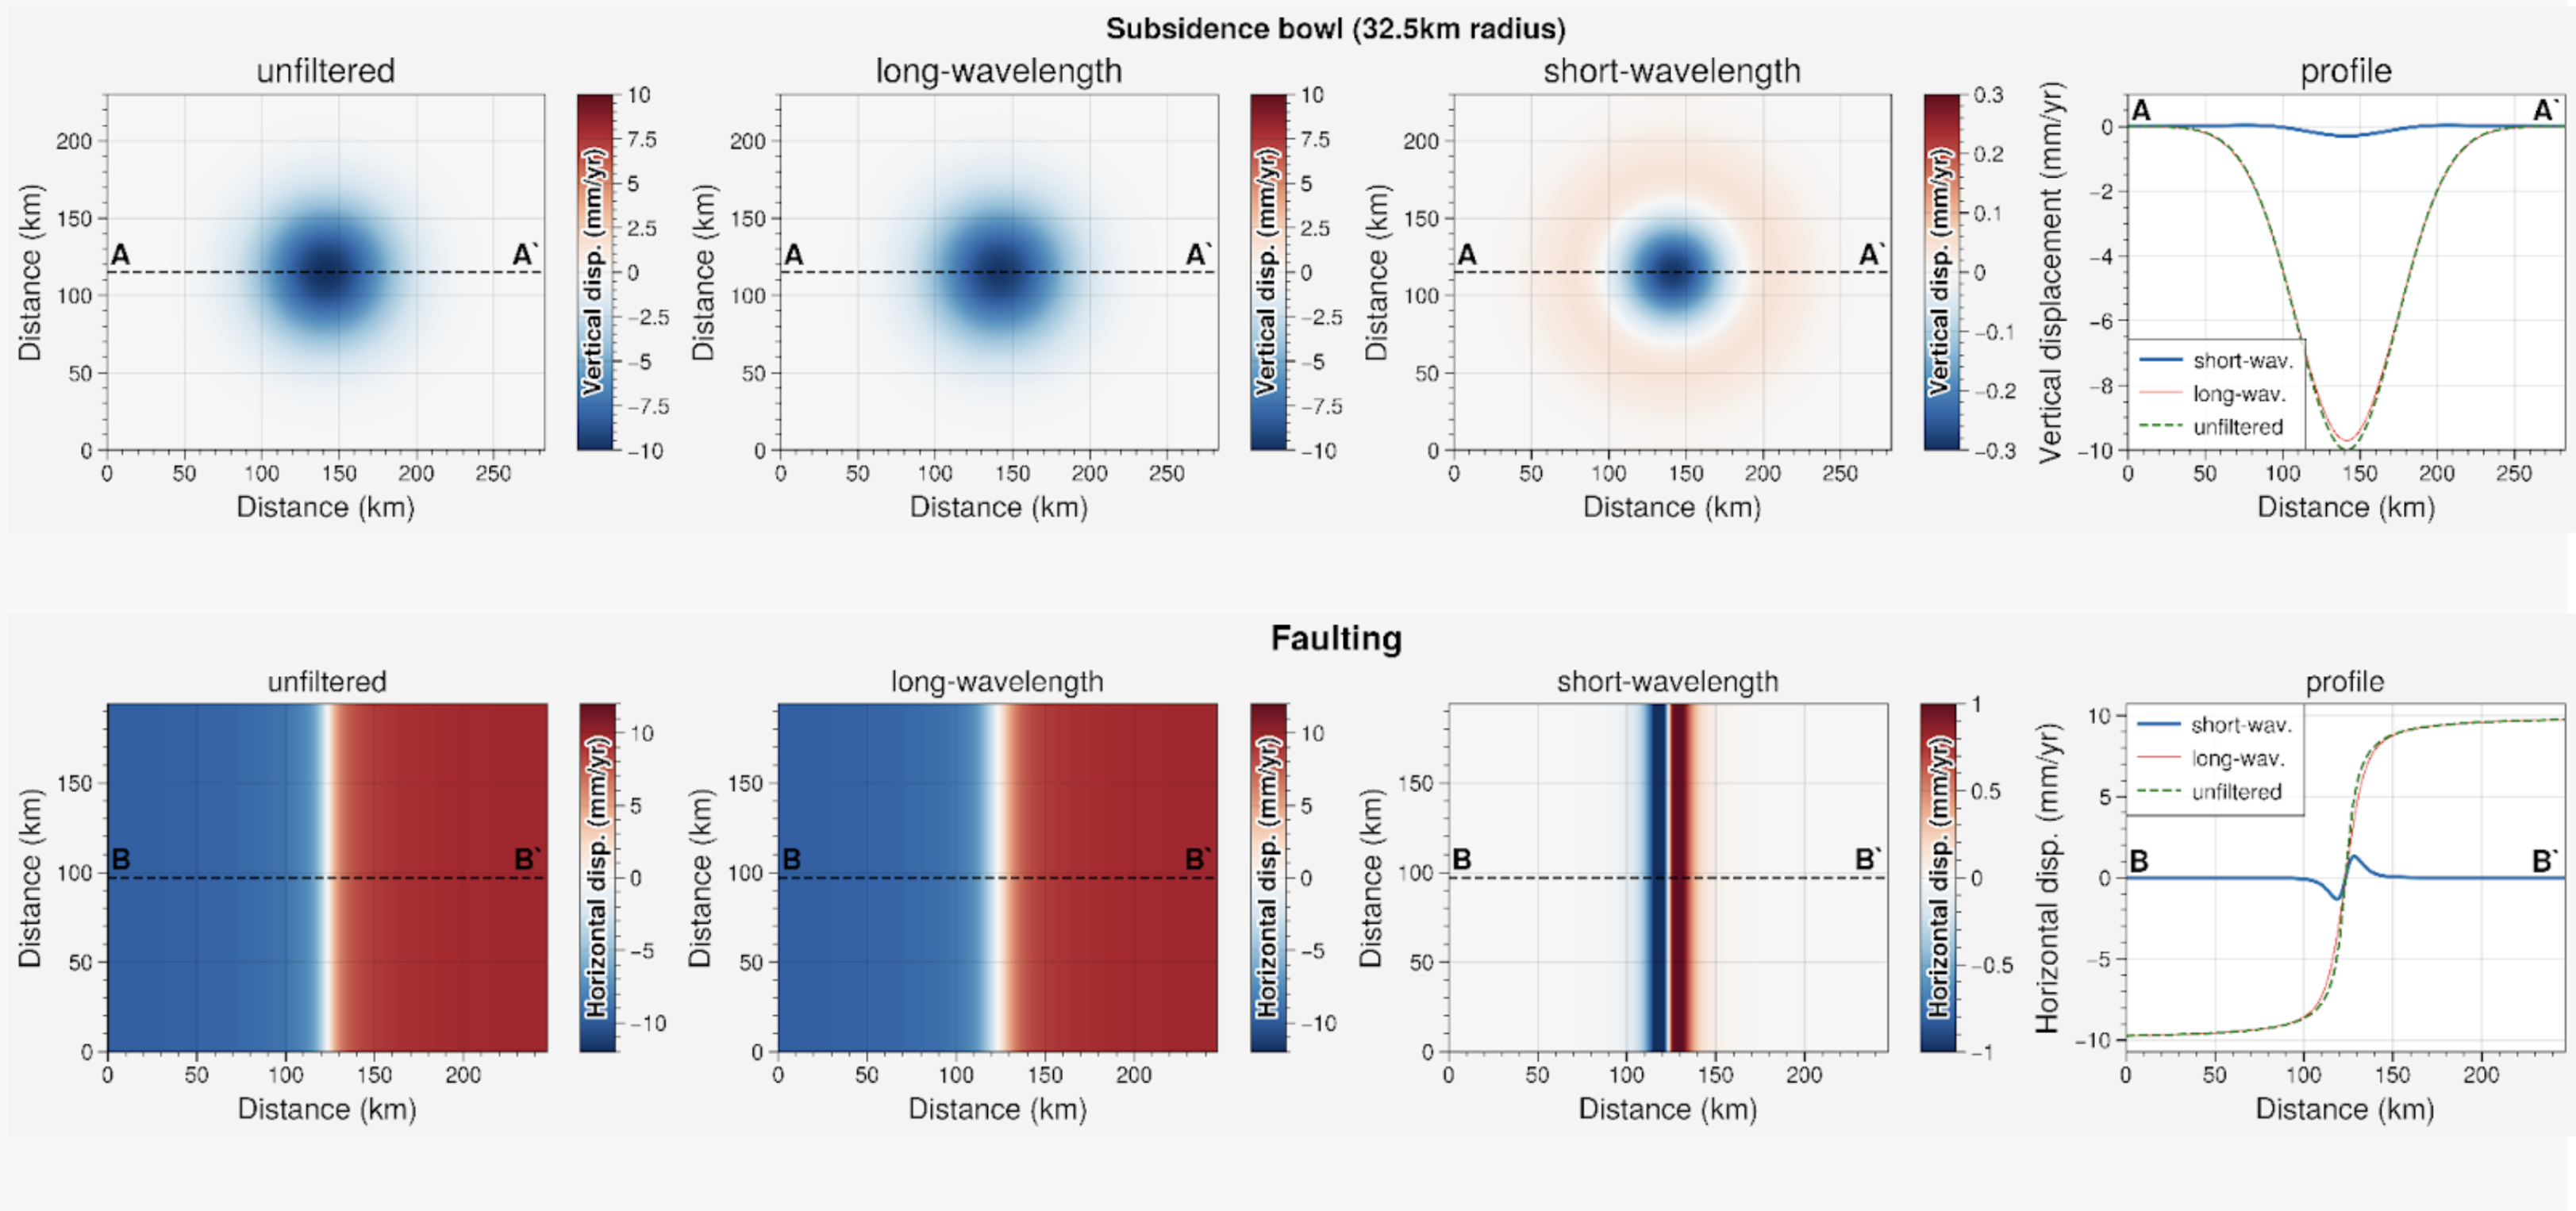
Figure 1 illustrates the filtering approach, which removes signals greater than 30 km in spatial scale. The examples shown include: (top row) a 65 km diameter subsidence bowl and (bottom row) a creeping right-lateral transform fault. After the long-wavelength signal is filtered, the remaining "short wavelength" signal contains local displacement plus any residual between the true and filtered long wavelength signals. Notice that the filtered subsidence bowl has apparent uplift along the edges. An analogous real-world example can be found in the Displacement Portal along the Central Valley of California (lat: 37.0768, lon: -120.5237). The filtered fault creep signal shows local displacement next to the fault and no displacement in the far field. An analogous real-world example can be found in the Displacement Portal along the Central San Andreas Fault near Parkfield, CA (lat: 36.2635, lon: -120.8569).
Below we demonstrate a real data example of short wavelength filtered and unfiltered displacement signals for the Central Valley of California (see Figure 2).
Figure 2
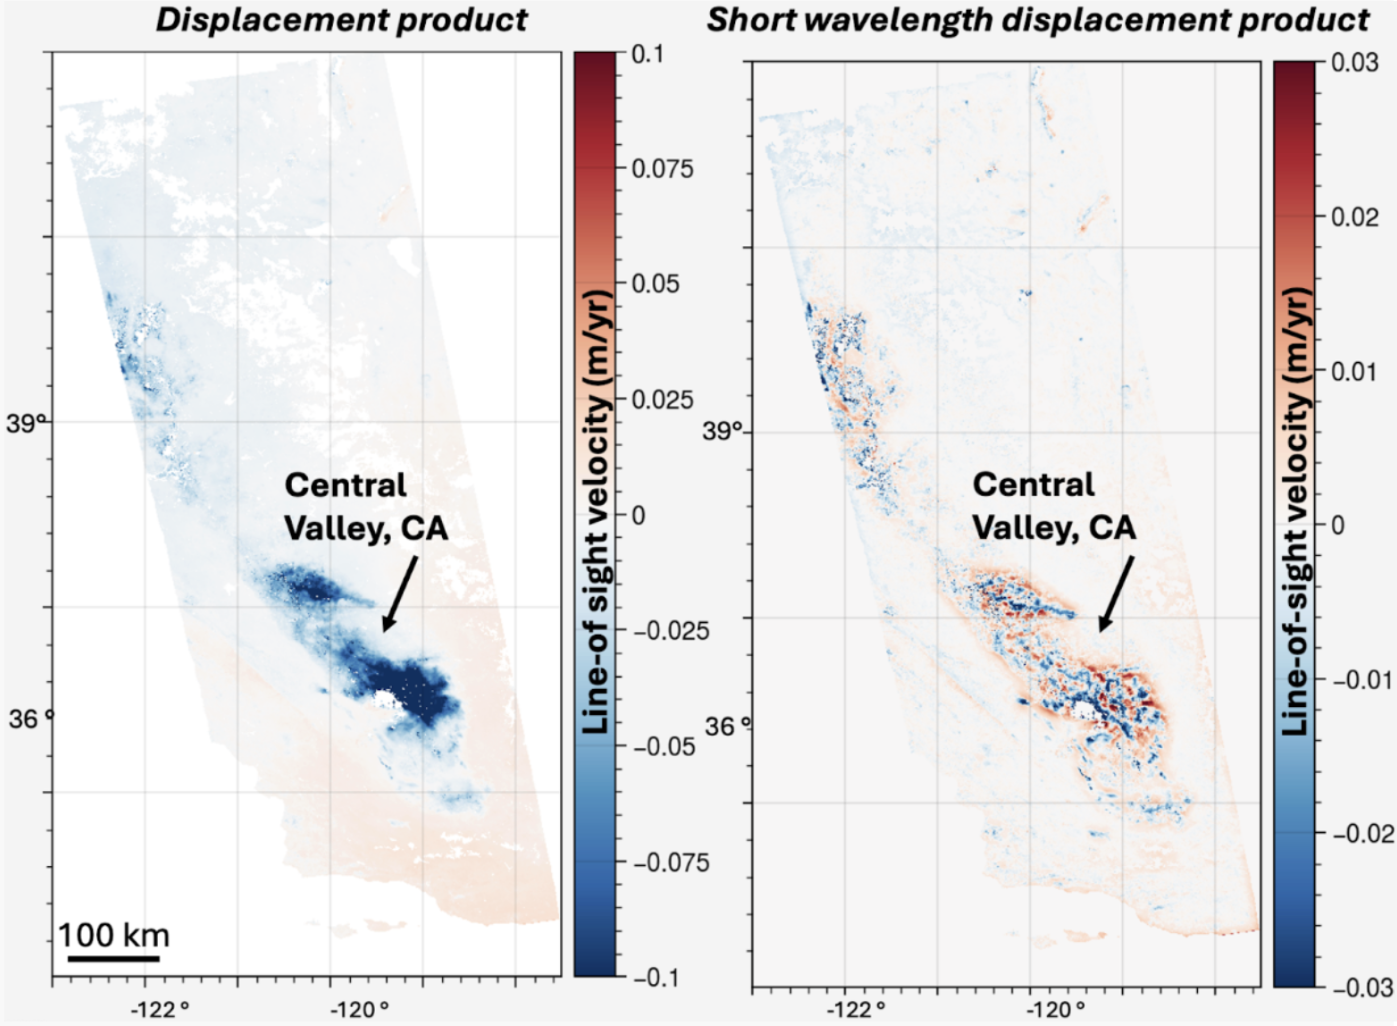
Figure 2 illustrates the filtering approach, which removes signals greater than 30 km in spatial scale on the OPERA DISP product. The example showcases the impact of filtering on the large-scale subsidence in the Central Valley of California (approximate lat: 37.0768, lon: -120.5237).
How do I access the unfiltered displacement data?#
The unfiltered displacement datasets are available and can be downloaded as part of the OPERA-S1 dataset through Vertex. Choose the DISP-S1 file type, and you will see the downloadable NetCDF file (with a “.nc” extension) available. You must be signed into your Earthdata account to download these products. Refer to the Vertex User Guide for more information. You may also download the data through NASA Earthdata.
Note that the unfiltered displacement layer from the DISP-S1 product will not reflect what is visualized in the portal, since the portal only displays the short-wavelength layer.
What are the data units in the Displacement Portal?#
Velocities plotted in map view are in units of meters per year (m/yr). The map overlay is colorized from -0.03 m/yr (blue) to +0.03 m/yr (red) by default. Local Displacement (i.e. short wavelength displacement) in the time-series plot is in units of meters in the line-of-sight direction. The colorscale is fixed but future updates will allow users to adjust the colorscale.
How are the time-series referenced in time and space?#
Each Displacement product measures ground displacement relative to a specific reference date (see details in the Product Specification Document). The Display Portal map displays Basic Velocity for each pixel relative to the first available date with data for that pixel. The zero Local Displacement value in the plot is set by the first available date. The reference date and series in the plot can be changed by right-clicking on a point within a particular AOI series and selecting "Shift to zero". Note again that due to the short wavelength filtering process, there is no single global reference point; the spatial reference is the local average of the data.
How often are the data updated in the portal?#
The OPERA velocity measurements displayed in the portal will be updated weekly and will initially cover the period from July 2016 through December 2024. The portal products will be updated to current day data by the end of 2025.
Why are some points missing (i.e., masked)?#
Points are missing if the data fail to meet a set of quality metrics, such as level of temporal coherence and phase similarity amongst neighboring pixels. These quality metrics are captured in the Recommended Mask layer in the OPERA DISP product (see the Product Specification Document). Factors that contribute to these quality metric issues can also include the presence of water bodies, ground motions that are too rapid to be resolved, and changes in surface characteristics (e.g., vegetation loss/growth and/or snow/ice cover).
In map-view: If the Recommended Mask identifies a pixel as low quality at any time, that pixel will not appear on the map. However, even if a pixel is missing from the map, time series data may still be available for that location if you click on it.
In the time series chart: If the Recommended Mask identifies a pixel as low quality at any point in time, that pixel's data will be marked with a hollow dot symbol on the chart. Between these masked data segments, it is assumed that no displacement occurred.
Why do I get an error message (e.g. “Timeseries Service Error”) when trying to plot data?#
These are the types of errors that will cause the "Timeseries Service Error" message:
- The selected area is outside the dataset coverage (e.g. over the ocean, outside of the geographic scope of the data (e.g., over Europe).
- There is no data processed over the given frame.
- There is no valid data at the selected point. This happens when all short-wavelength displacement samples for the given AOI are pre-filtered by the dataset's validity mask.
Are InSAR corrections applied to the time-series displayed in the Displacement Portal?#
There are no InSAR corrections applied to the data displayed in the Portal.
Data for applying InSAR corrections (e.g., solid earth tides, ionospheric delay) are included as separate layers in the DISP product (see the Product Specification Document).
Where is the OPERA Surface Displacement Product Specification Document?#
Please refer to the dedicated DISP-S1 product page on the OPERA website, found here.